Data Visualisation.
Turning raw CSV data into actionable insights using Matplotlib and Pandas.
View Source Code
Python
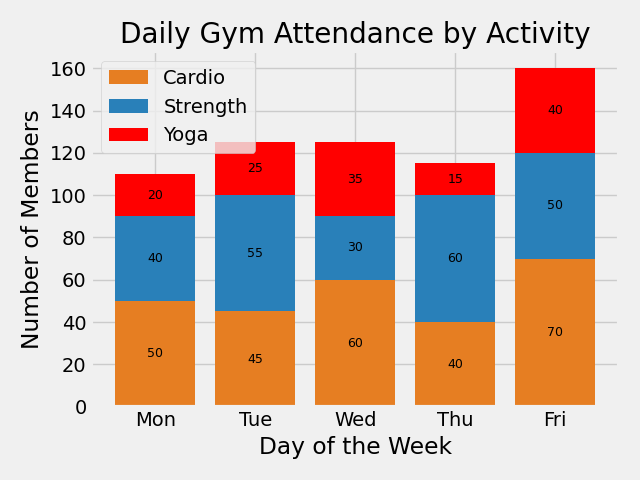
Gym Attendance (3-Layer Stack)
Complex manual stacking using Matplotlib to visualize Cardio, Strength, and Yoga attendance across a week.
Python
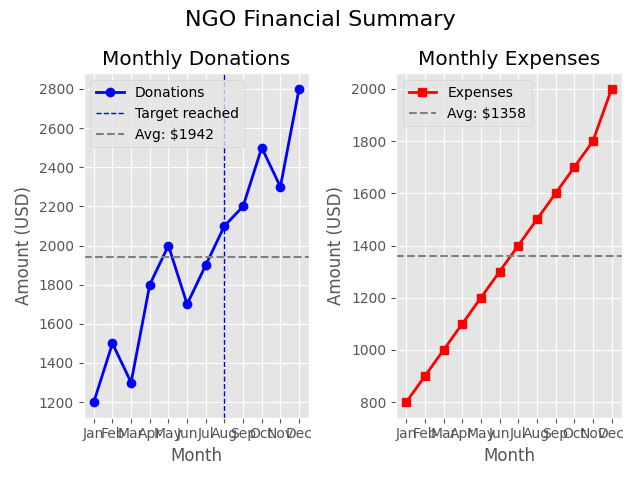
NGO Financial Summary
Dual-subplot line charts with markers, rolling averages, and target lines to track donations and expenses.
Python
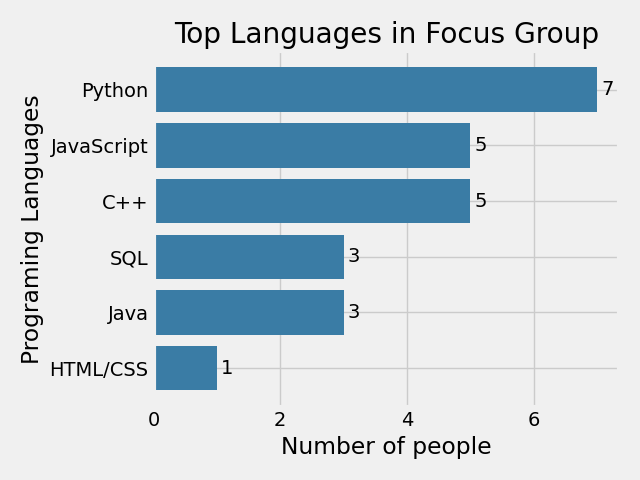
Language Popularity
Parsing complex CSV strings with semicolons and using collections.Counter to plot the most popular languages.
Pandas
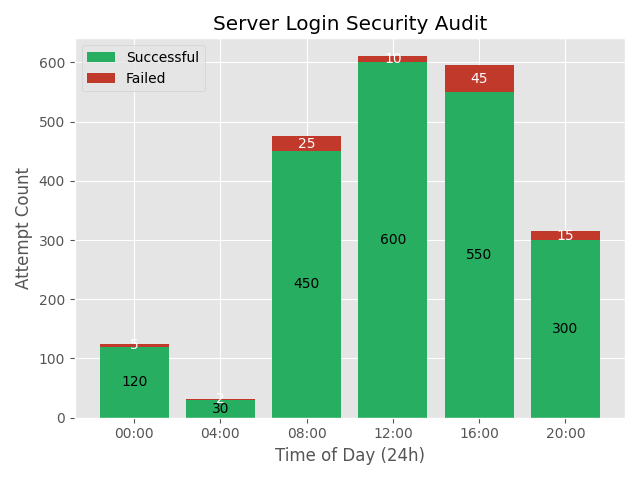
Server Security Audit
Transitioning to Pandas to load login data and visualize successful vs. failed server login attempts by hour.